Visualizing Science 2015: Beautiful Images From College Research
As part of a continuing tradition, we invited faculty, staff and students in the College of Natural Sciences community to send us images this past spring that celebrated the magnificent beauty of science and the scientific process. Our goal was to find those moments where science and art become one and the same.
Scientific discovery often entails a visual aspect, as researchers graphically communicate their discoveries and explore the topics that inspire them. Darwin traced evolutionary trees in his notes, Hooke sketched his astronomical and microscopic observations, Franklin made X-ray diffraction images that were vital to determining the structure of DNA, and Feynman devised diagrams that helped transform theoretical physics, just to name a few.
More and more, scientific visualizations are becoming an integral part of the discovery process. Researchers use 3-D models and data visualizations to expose patterns hidden within data, to reveal the inner workings of life or to explain the very structure of the universe.
Below we feature six of the most stunning submissions from our scientific community. The first five images were chosen by committee based on their beauty and scientific merit. The final image, our People’s Choice winner, was chosen by the public on our Facebook page. These images will be displayed in The University of Texas at Austin Tower, Welch Hall, and the Kuehne Physics Mathematics Astronomy Library in Robert Lee Moore Hall.
FIRST PLACE
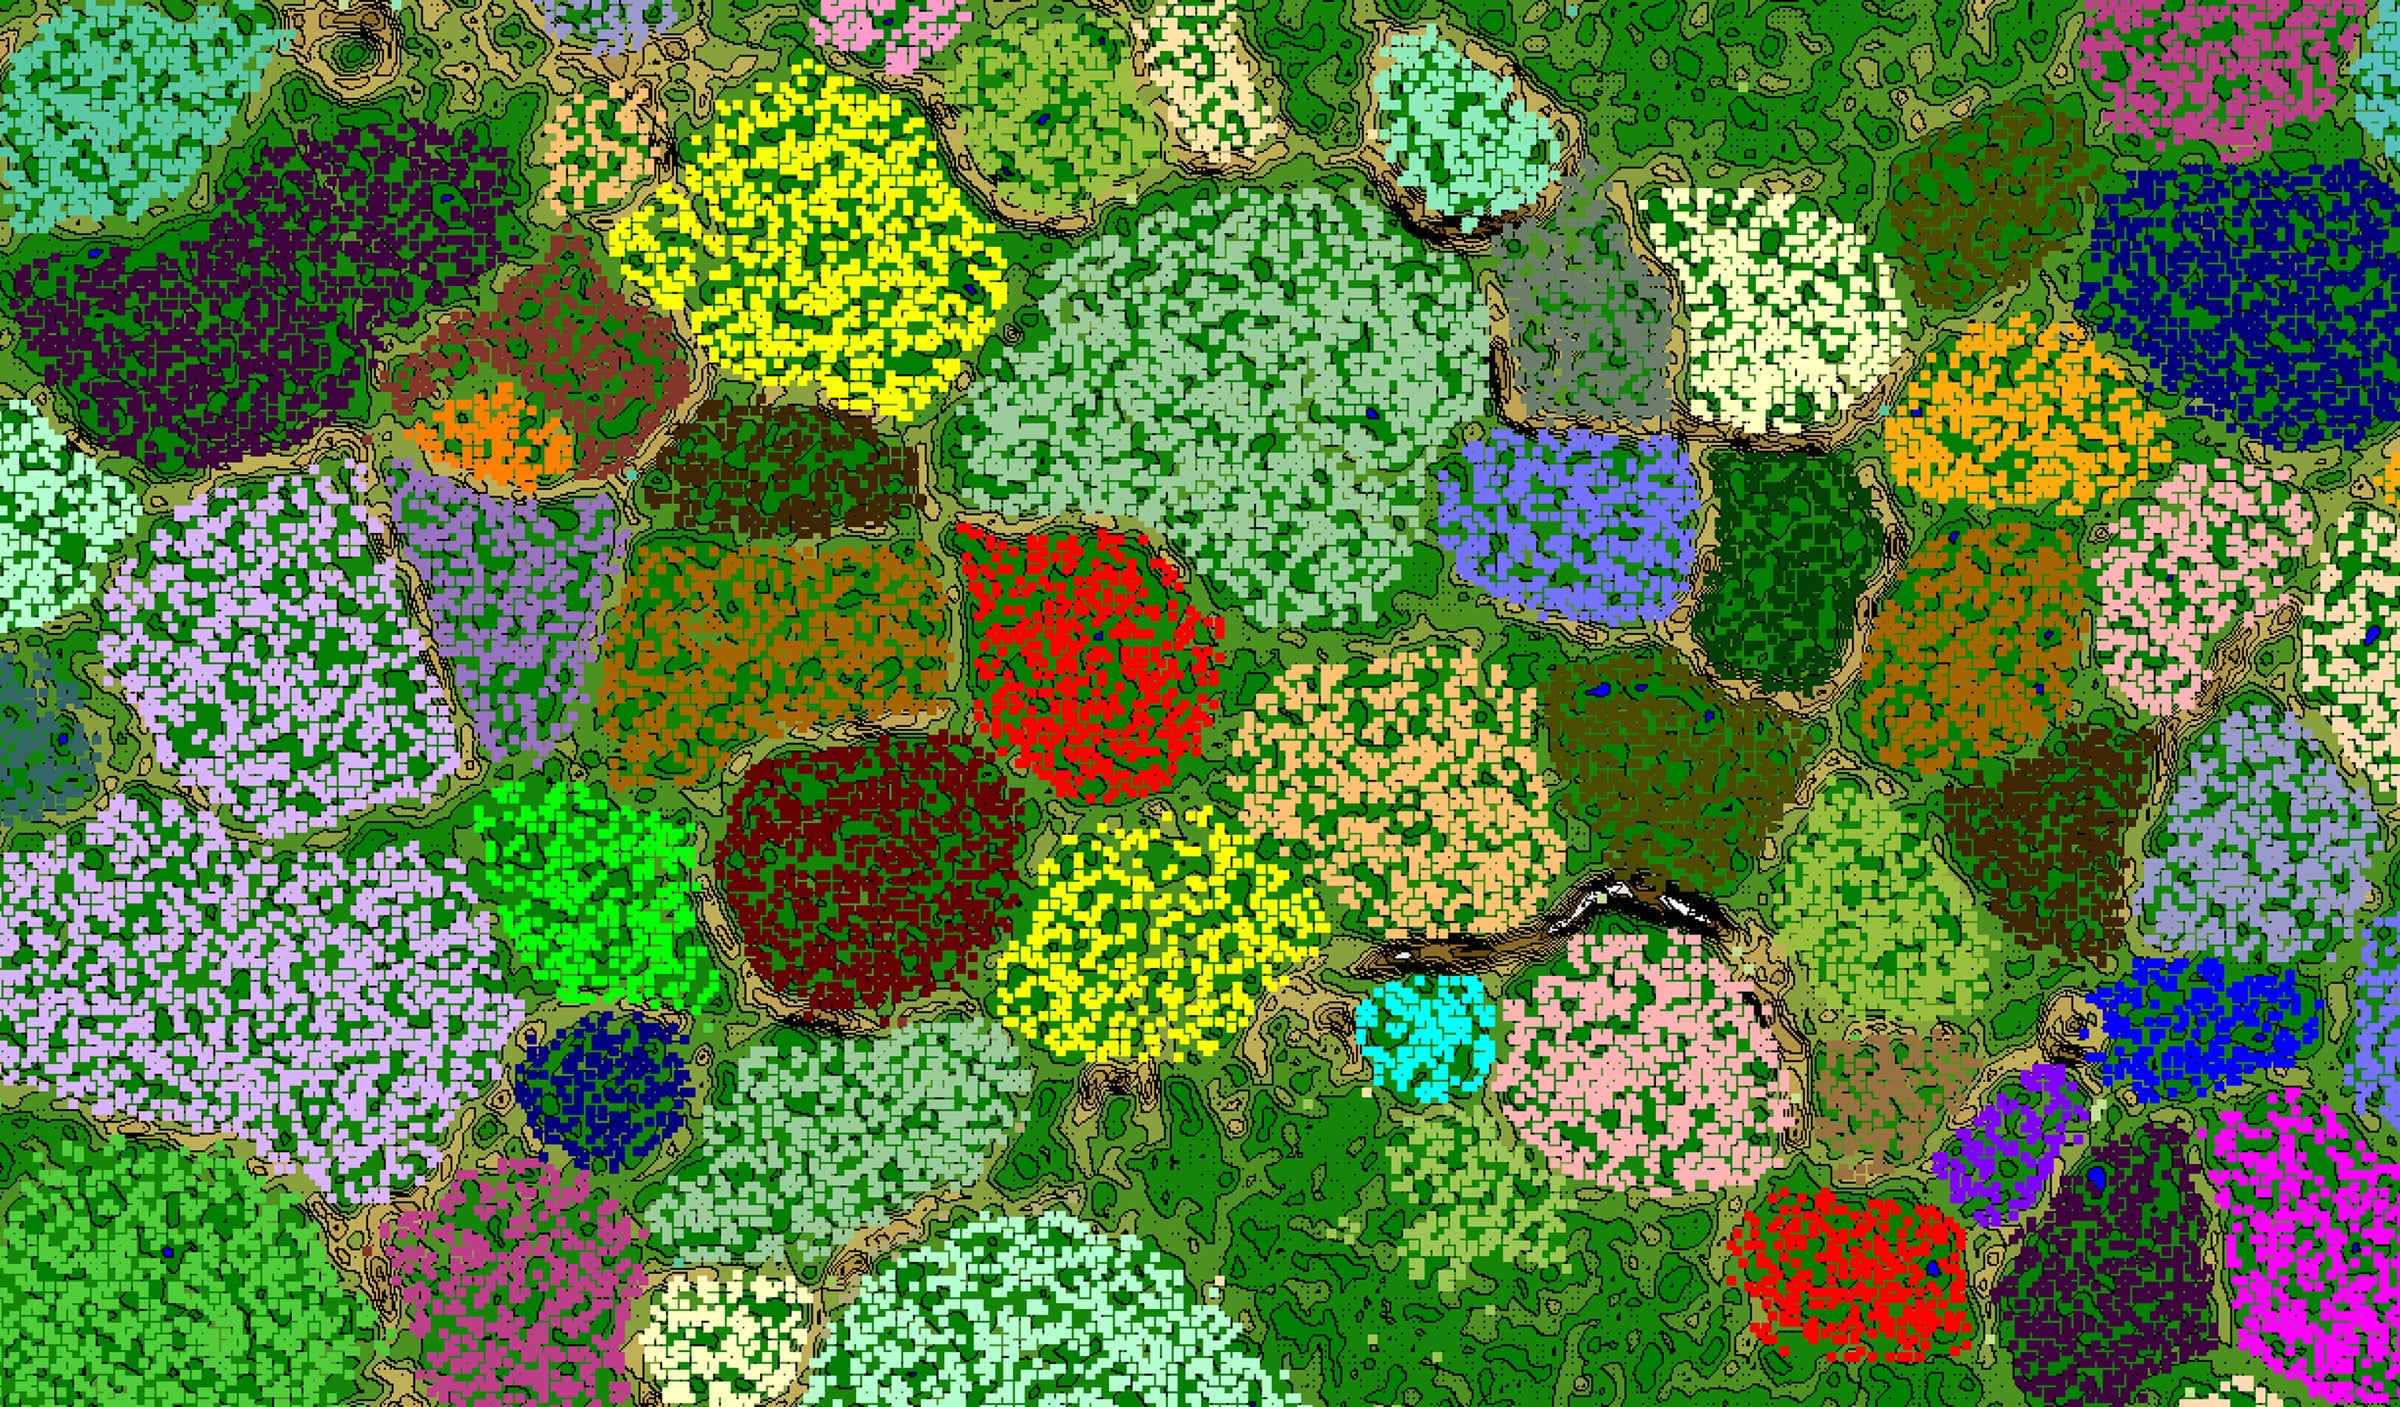
Genomes for most microbial life in the ocean have yet to be sequenced. This is a map of DNA fragments sequenced from the Gulf of Mexico dead zone. The dead zone is an area of low oxygen in the Gulf. Each square is a different DNA fragment from the water. The colored groupings—based on similar DNA sequence composition—represent genomes of newly discovered species that are important to the ecosystem. – Brett Baker, PhD, Assistant Professor in Marine Science.
SECOND PLACE
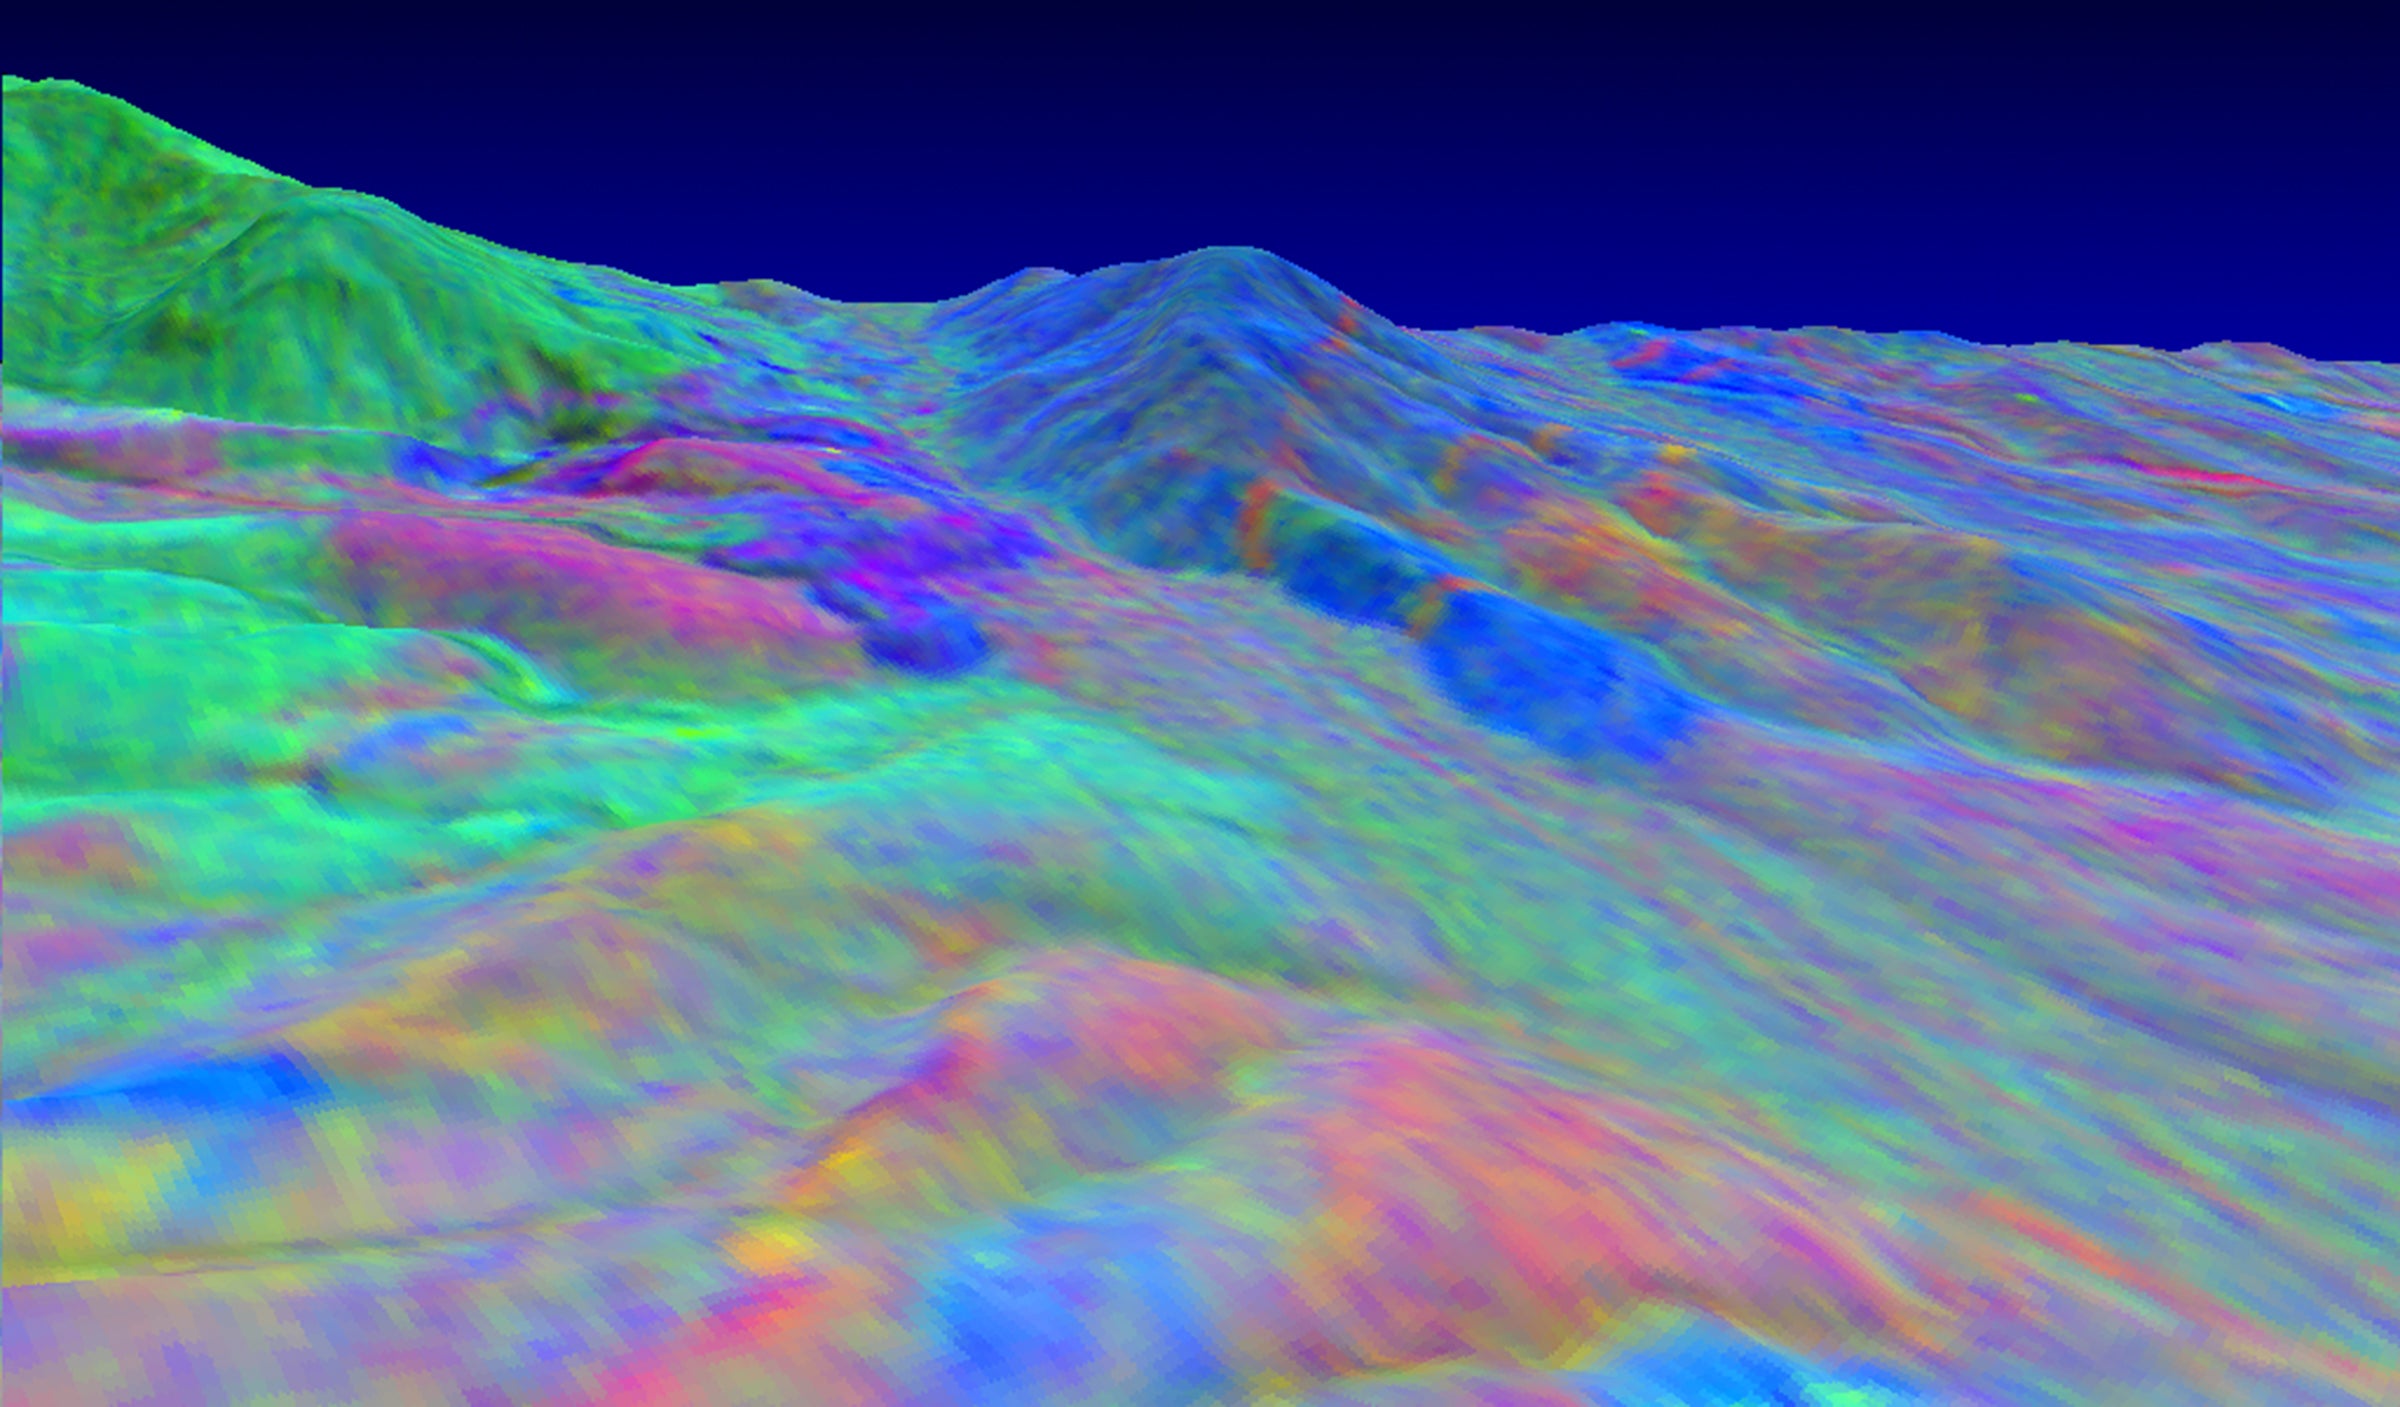
Thermal infrared multispectral imaging is a reconnaissance technique that discriminates between carbonate and silicate minerals using their distinct infrared emissivity at wavelengths from 8 to 12 micrometers. Made with NASA’s Thermal Infrared Multispectral Scanner, this image of the southern Providence mountains in California depicts diorite roof pendants in blue, gold-bearing quartz monzonite intrusions in red, and sedimentary carbonates juxtaposed by faulting in green. The Vulcan Mine, in the center field, is an iron skarn hosted in carbonates, and was mined during the second world war by Kaiser steel for shipbuilding. Numerous small bonanza gold mines dot the region. To appreciate the geologic power of this technique, go online and compare with an aerial color photograph. The technique has been employed over Mars, where it is impractical to map the entire planet with robots or geologists. – John Kuehne, PhD, Research Associate at McDonald Observatory (with special thanks to geologist Don Allen whose field work inspired the analysis).
THIRD PLACE
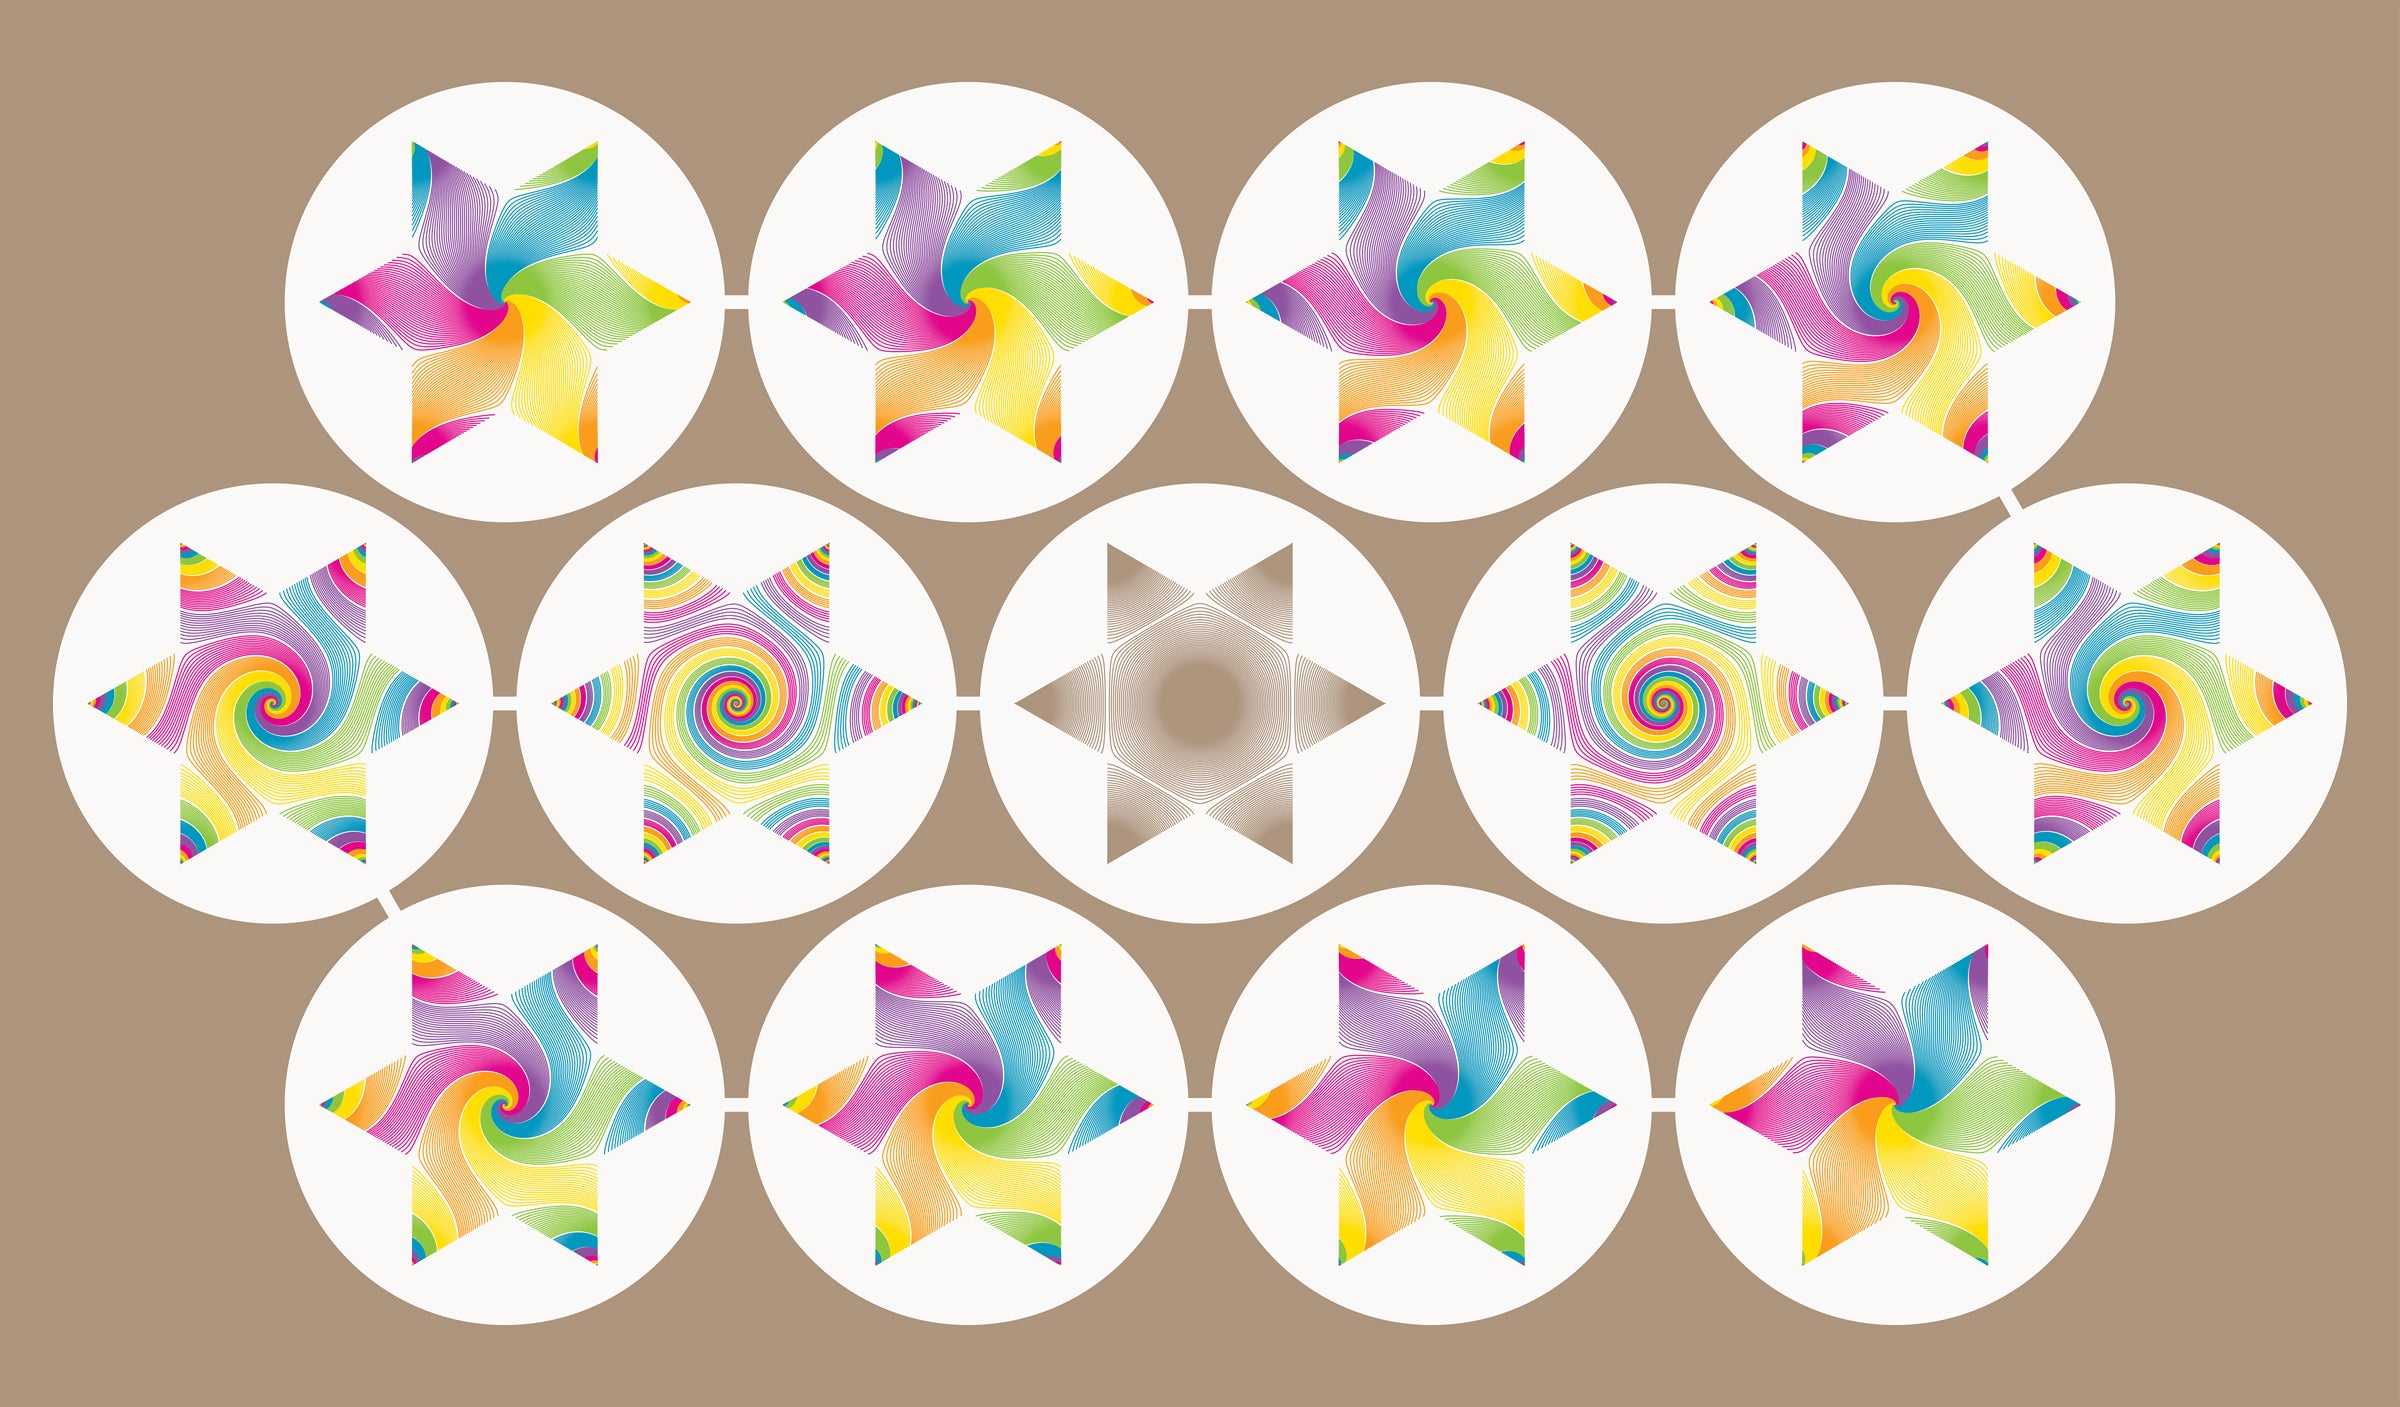
When geometers want to identify a complicated shape, they often look for clues in what it’s “wearing.” These drawings show variations on a “pinstripe suit” tailored to fit a shape that appears in string theory research. Halfway through the sequence of variations, the cut of the suit changes, spiraling in the opposite direction. At the moment of the change, a distinctive pattern of concentric circles appears. This pattern not only identifies the shape the suit fits, but also reveals features of the string theory the shape comes from. – Aaron Fenyes, Mathematics Graduate Student.
HONORABLE MENTIONS

Tree-like structures called dendrites pose a problem for makers of lithium ion batteries. When they grow across a battery, they can cause a short circuit, generating heat and even starting fires. The image here, taken with a digital microscope, stitches together thousands of individual frames of an electrode, as diverse dendrites form in webs and mossy clusters. Images such as these provide data for advanced modeling that can help predict and prevent dendrite growth. – Melissa Meyerson, Chemistry Graduate Student.
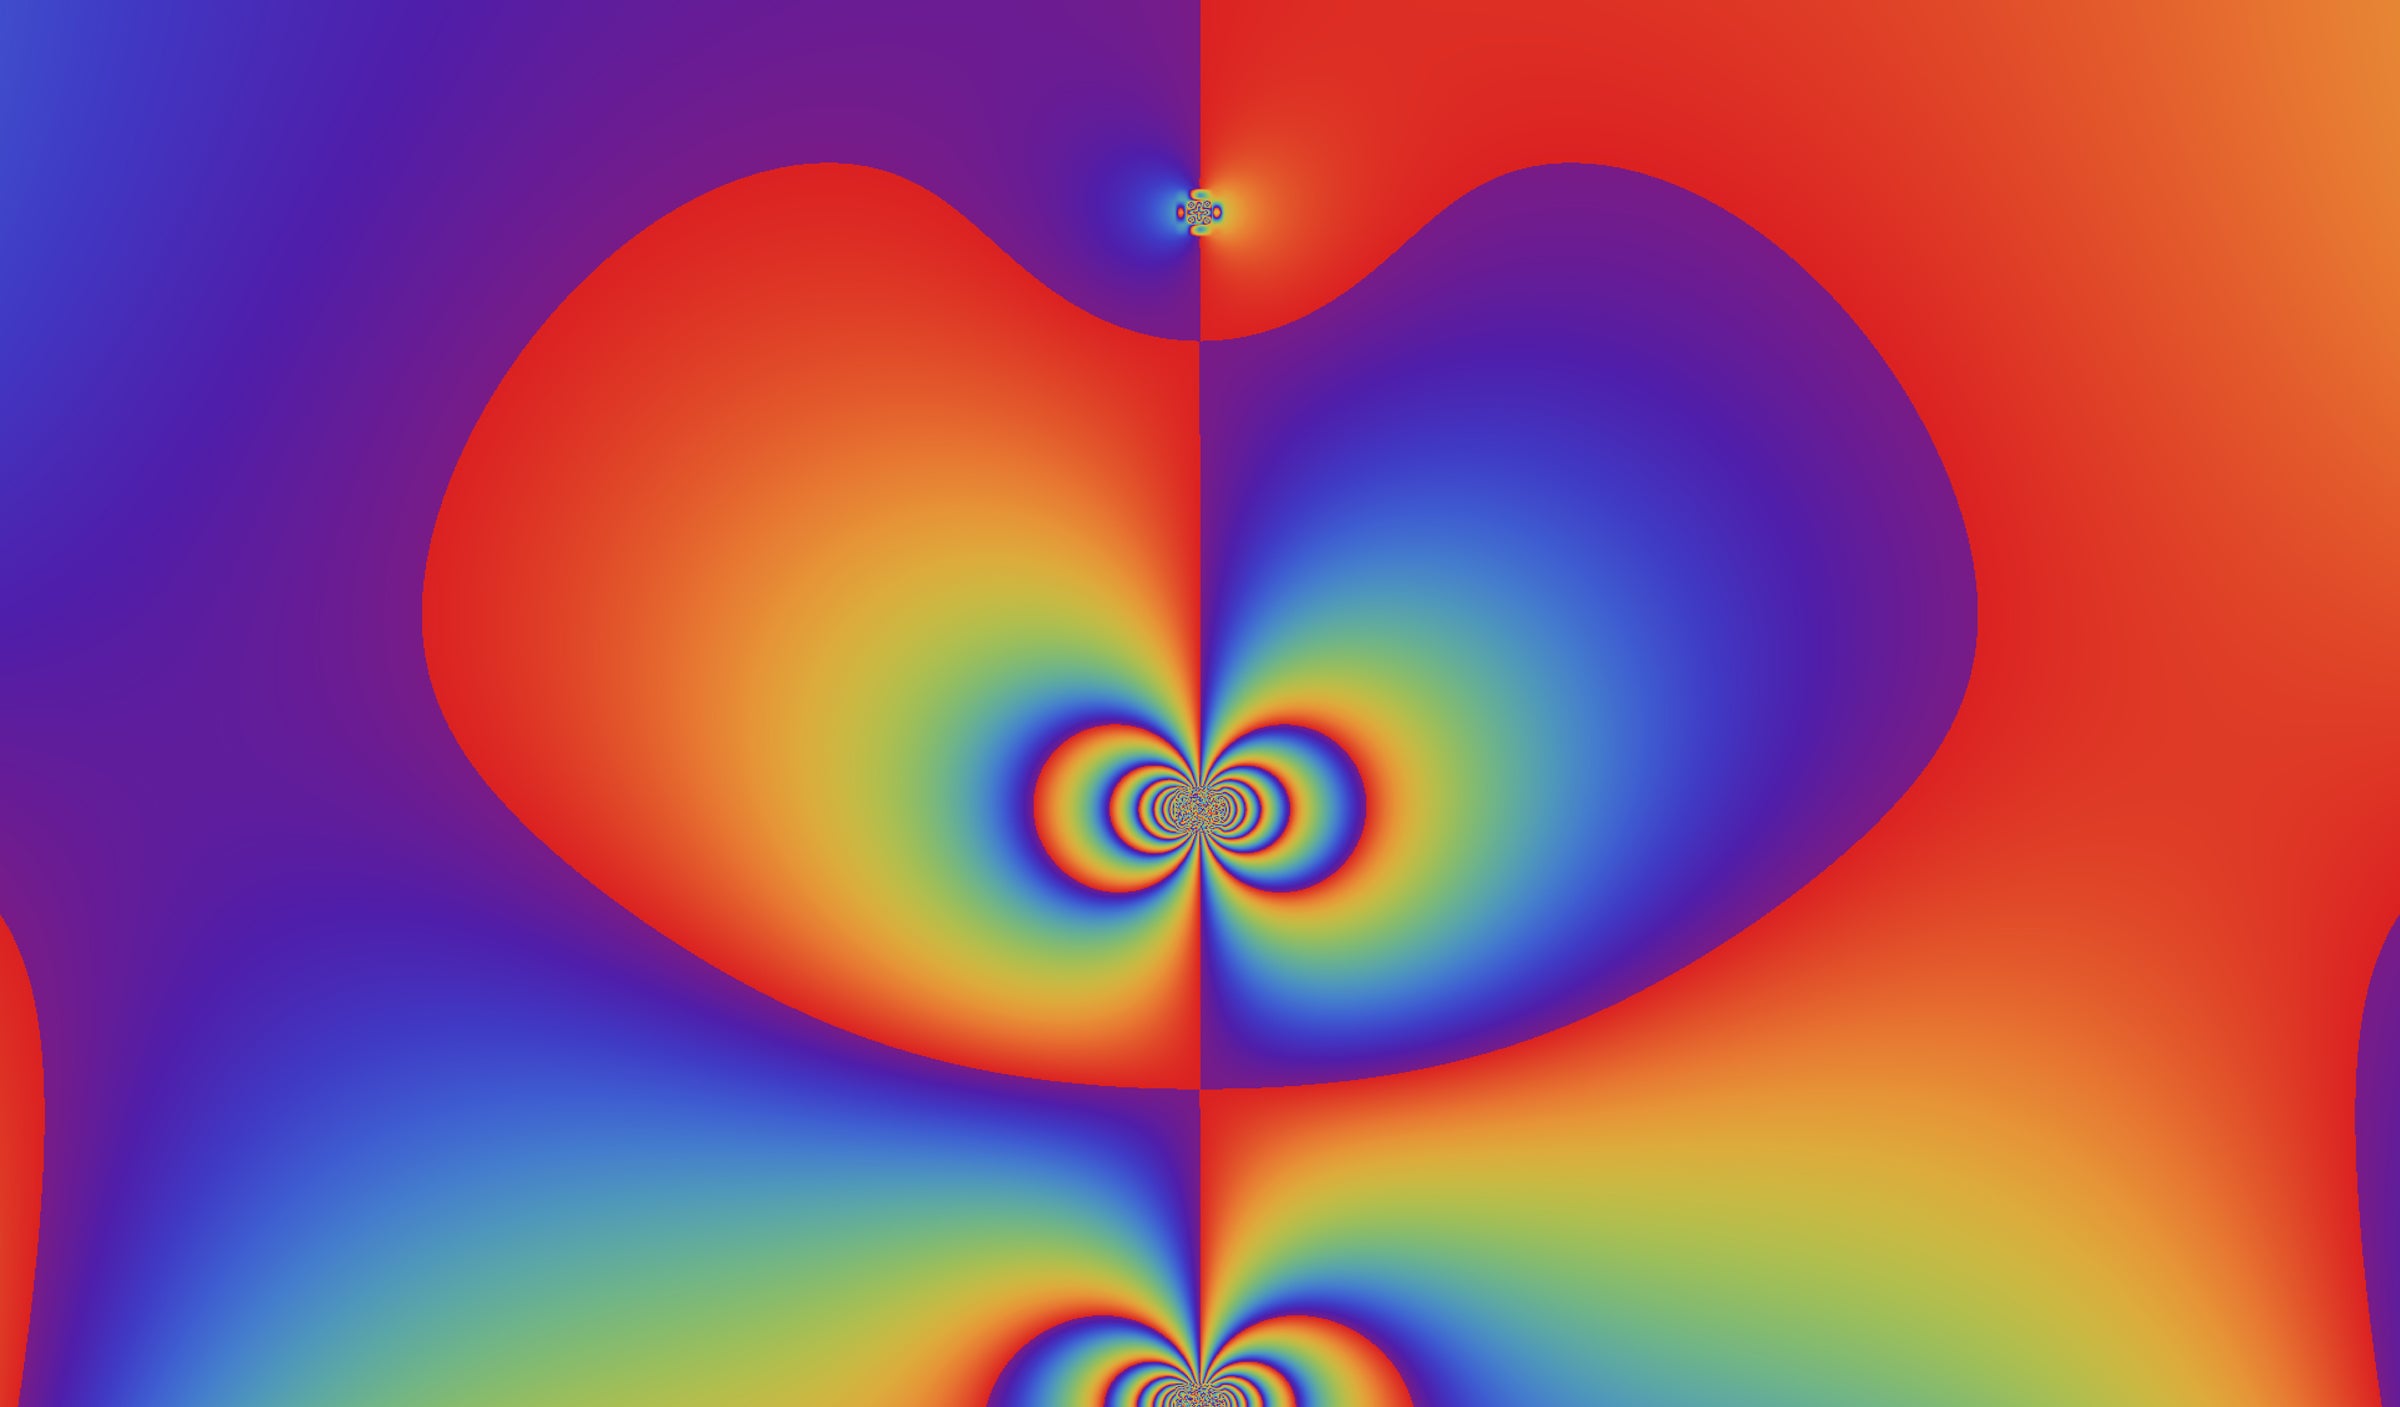
Zeta functions are used in math and physics to capture geometric information. They provide a way to establish relations between physical and numerical properties. This image shows the zeta function for a ring-shaped structure with symmetrical, bell-curve-like features. It helps explain how certain energies behave in a vacuum in ways that can create particles out of empty space. – Pedro Fernando Morales-Almazan, PhD, Lecturer in Mathematics.
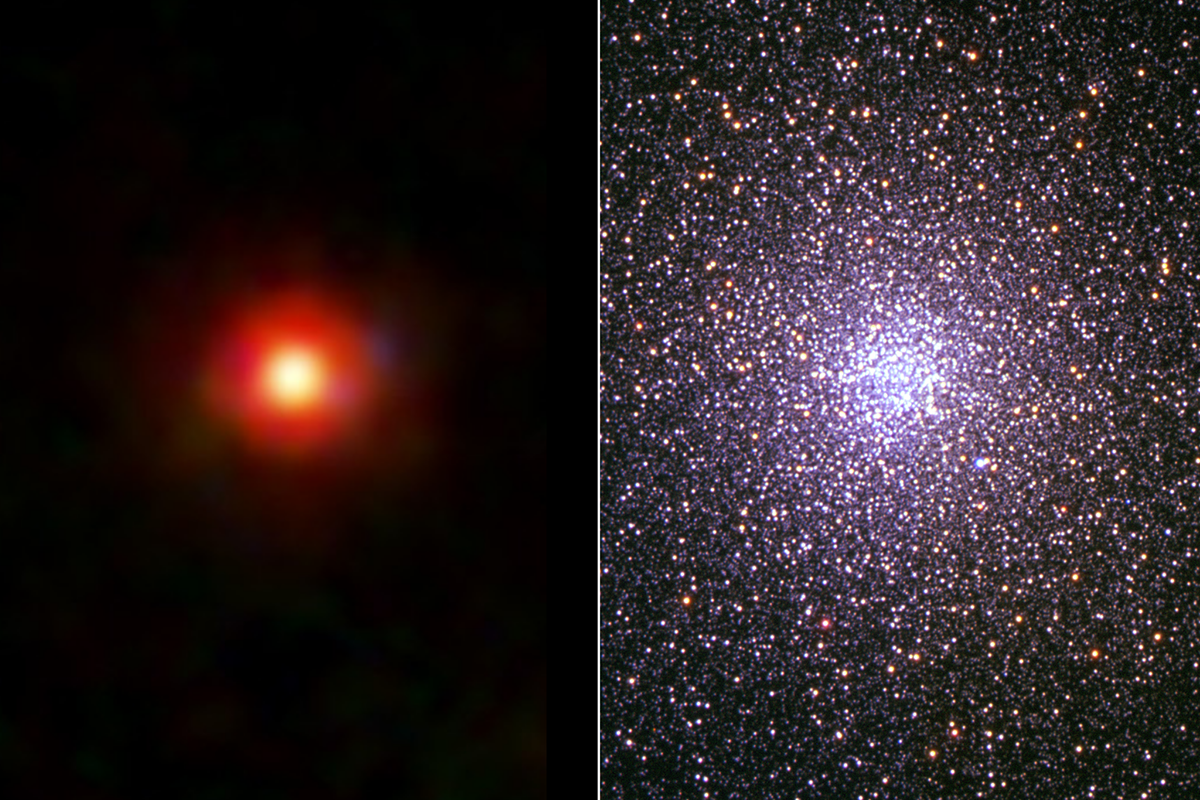
PEOPLE’S CHOICE
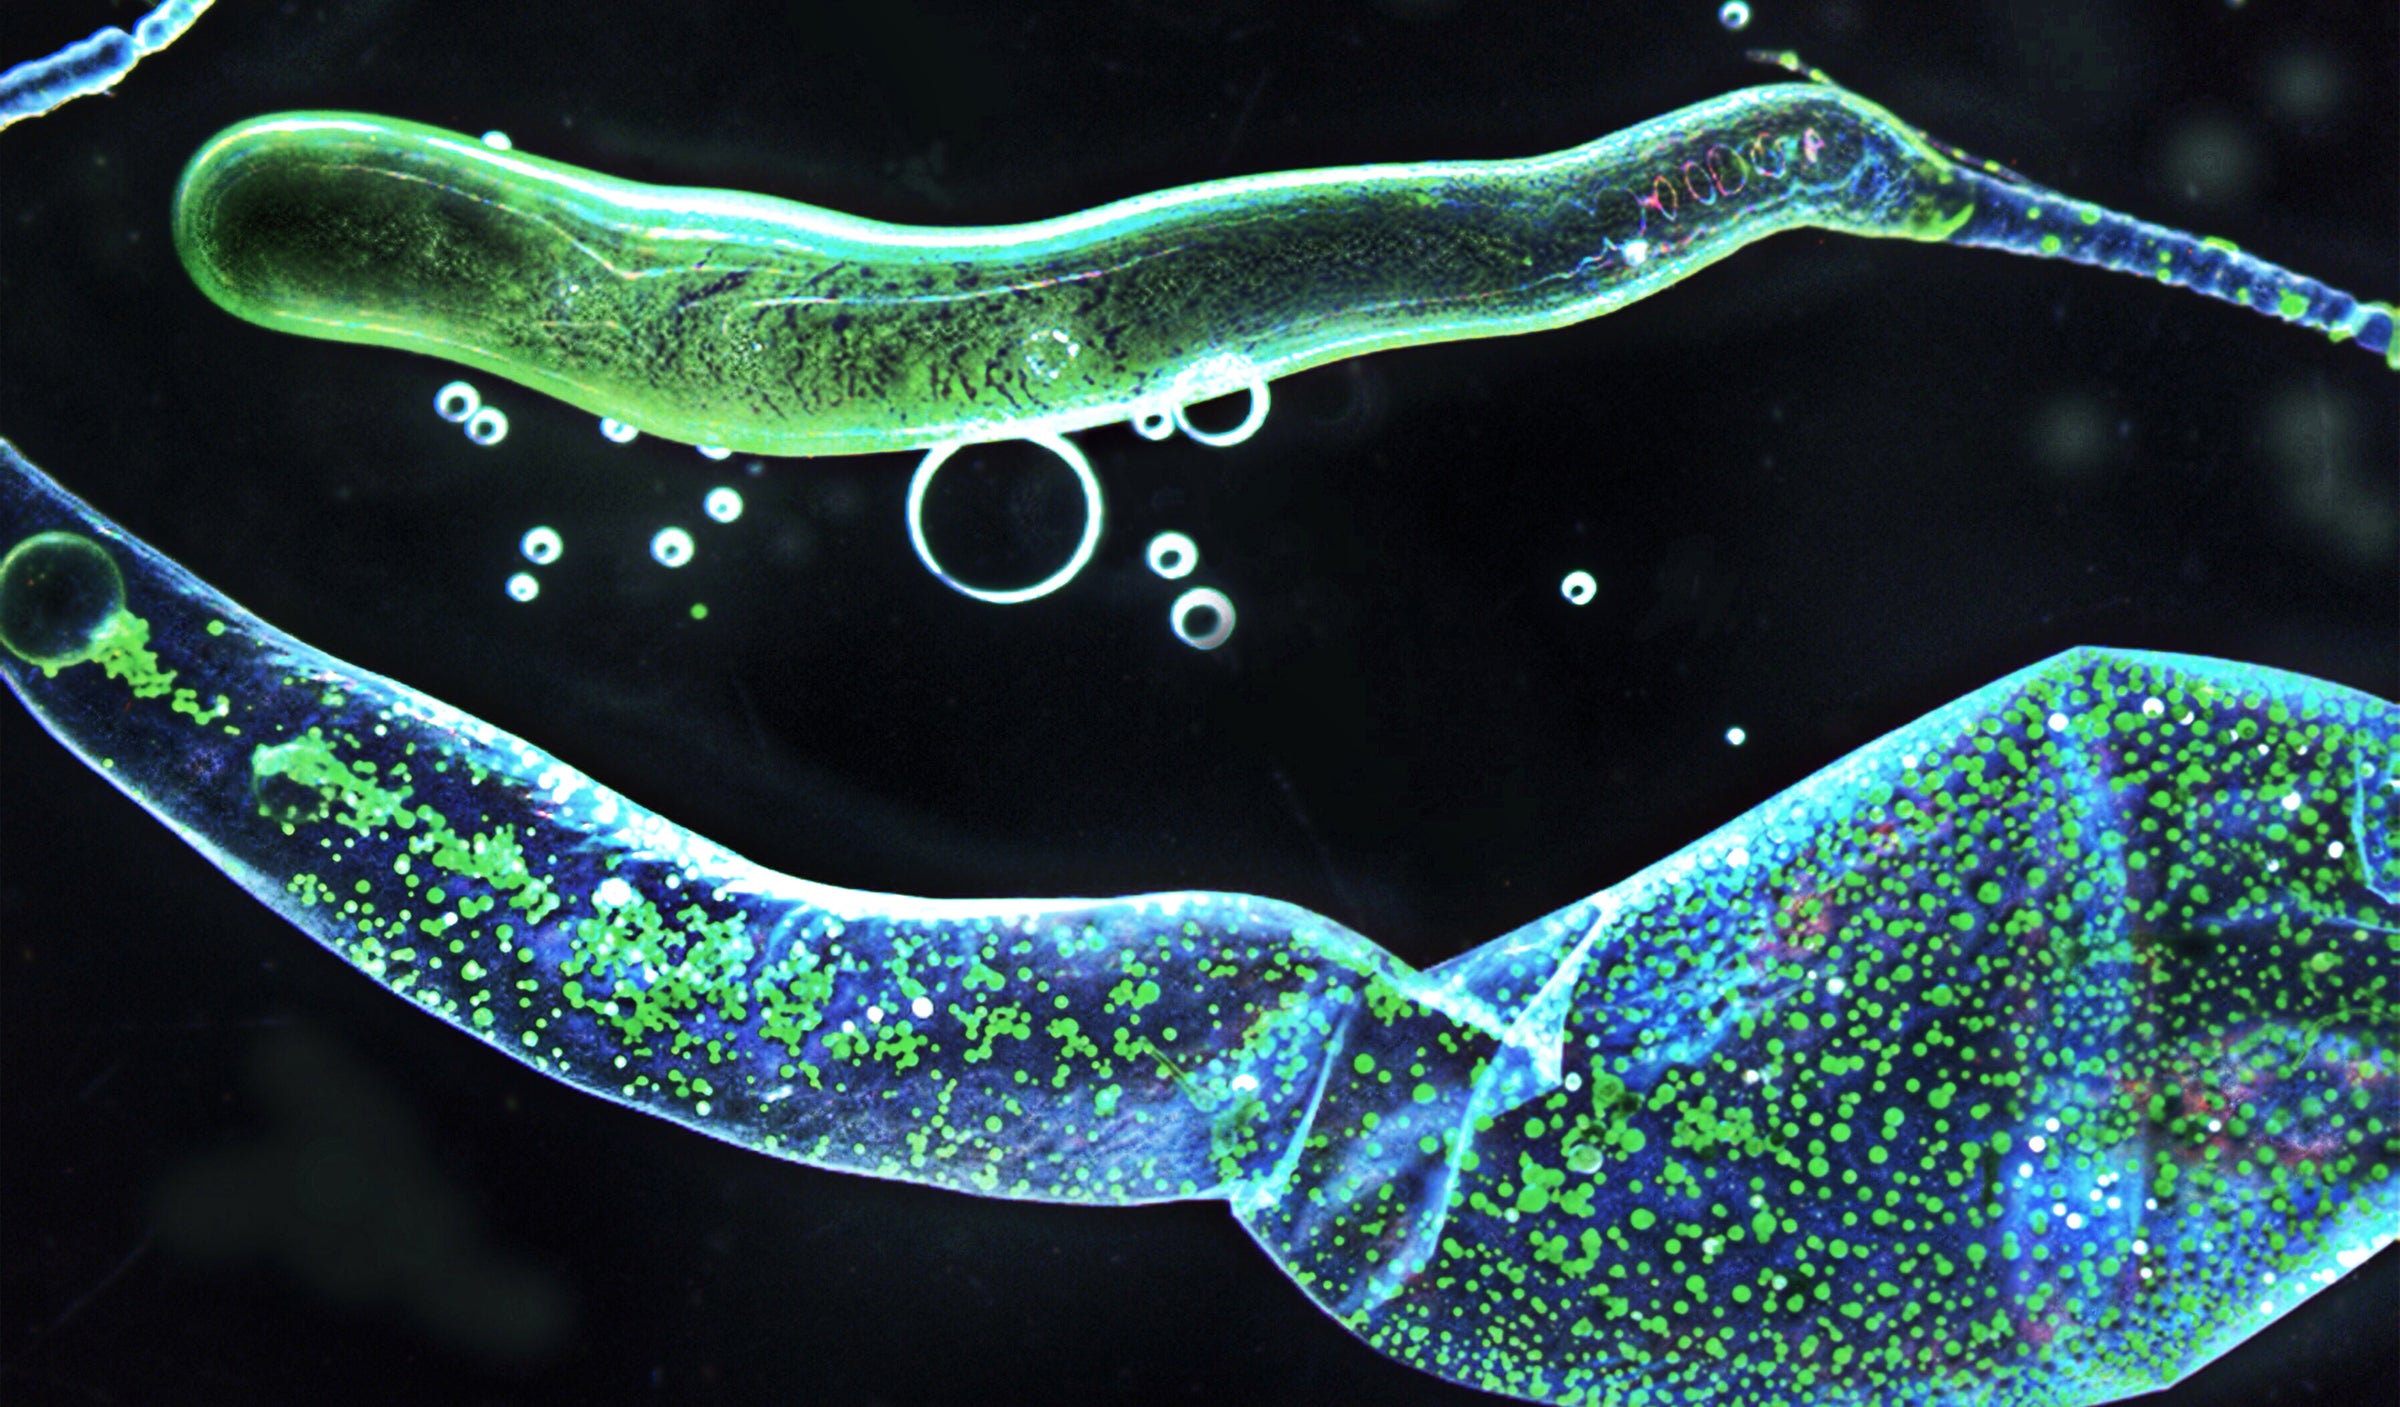
The algae, Boergesenia forbesii, has balloon-shaped cells filled with fluid. These balloons are single cells that can grow to be about 3 cm long and can rapidly divide to form hundreds of smaller new cells in just a few hours when wounded. These algae have been used to study wound responses in cells. – Culture Collection of Algae.