Vulnerable Neighborhoods Bore Brunt of Pandemic Well into its Second Year
A study in PLOS Computational Biology from University of Texas at Austin epidemiologists examined COVID infection and hospitalization rates by zip code.
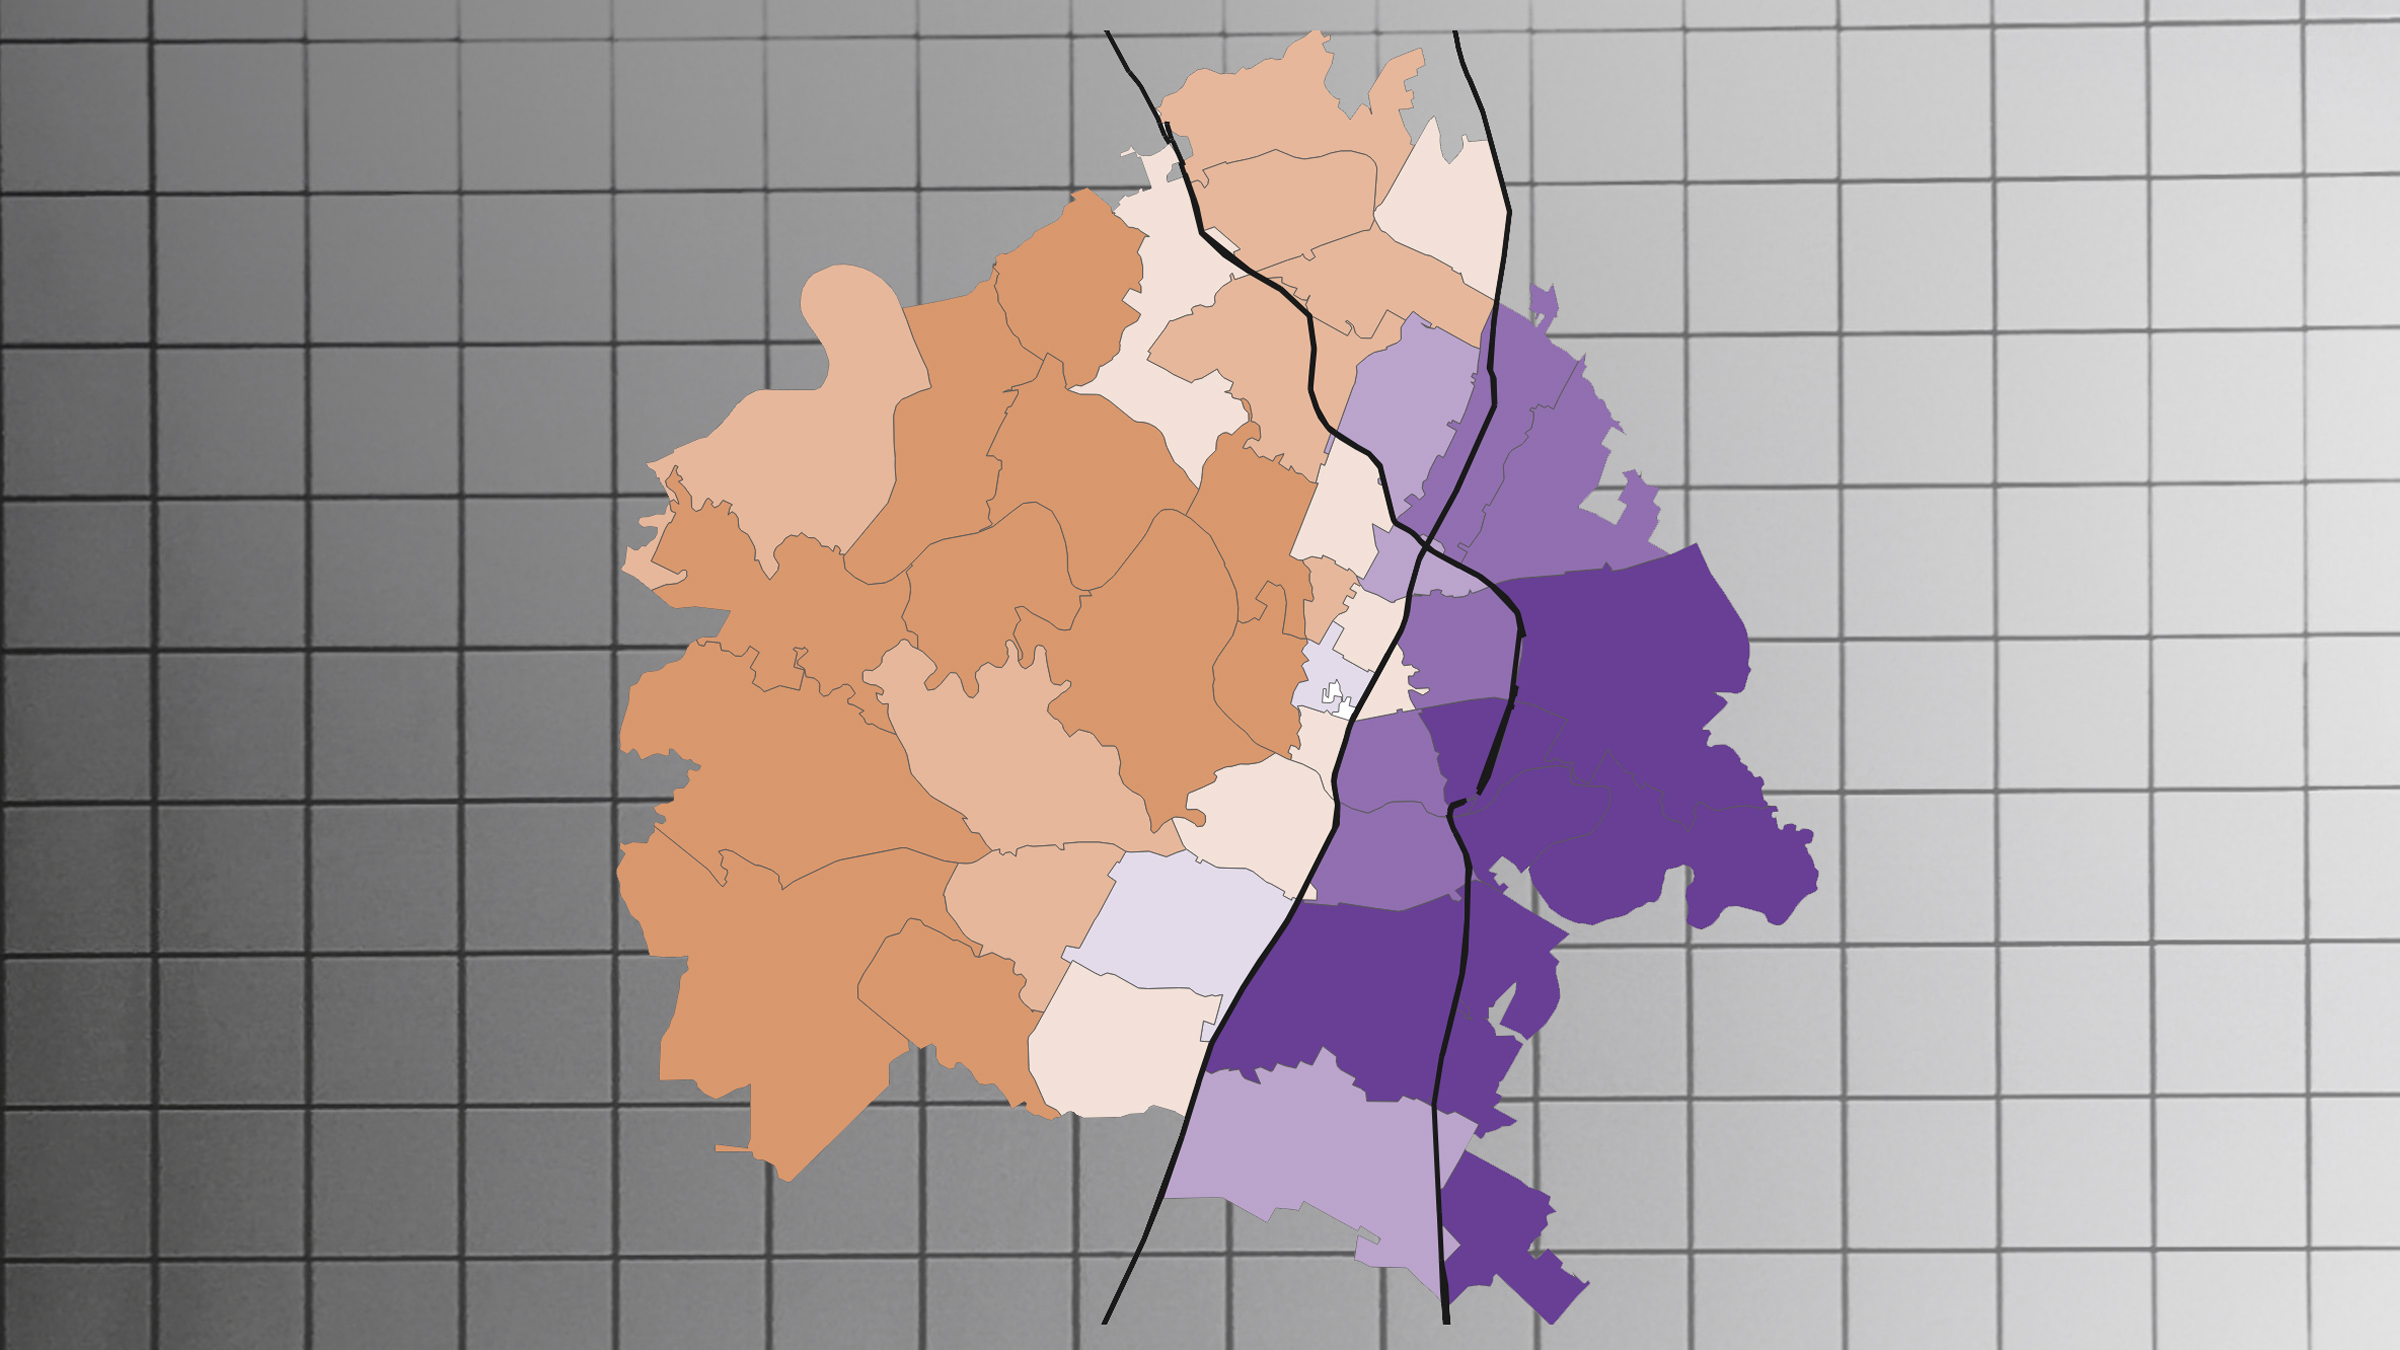
A recent study from researchers at The University of Texas at Austin found that in the first 15 months of the pandemic, infection rates by zip code were higher in East Austin than zip codes in West Austin. Shown is a map of the CDC’s social vulnerability index by zip code. Higher social vulnerability was linked with higher rates of infection during the first 15 months of the pandemic.
During the COVID-19 pandemic’s first 15 months, people in economically disadvantaged neighborhoods in a large U.S. city suffered infection rates up to 10 times as high as their counterparts in wealthier neighborhoods, research from The University of Texas at Austin has found. The findings could offer clues to address health disparities in future outbreaks and public health crises.
People living in ZIP codes in East Austin, where social vulnerability is high, were much more likely to be infected and end up in the hospital yet much less likely to have their infections reported than people living in historically better-off ZIP codes on the west side, a team of epidemiologists reports in a study out today in PLOS Computational Biology.
“As we reflect back on lessons learned from COVID, this study highlights that inequities within major cities, including Austin, led to much higher levels of COVID infection yet much lower rates of COVID detection in disadvantaged neighborhoods,” said Lauren Ancel Meyers, professor of integrative biology and director of the Center for Pandemic Decision Science. “These disparities persisted into late 2021, long after public health measures were taken to protect vulnerable populations.”
Scientists analyzed anonymized public health and hospitalization data from across Travis County and looked at several factors, including age and the ZIP codes where people lived. The study focused on March 2020 through June 2021. This included the early days of the pandemic and the introduction of vaccines but not the emergence of the delta and omicron variants.
The researchers estimated the changing burden of COVID-19 across the city in relation to the Centers for Disease Control and Prevention’s Social Vulnerability Index, which combines several factors, including the size of minority populations, education levels and household characteristics.
“We set out to identify parts of the city that suffered the worst throughout the pandemic,” said Spencer Fox, a first author on the paper who is now at the University of Georgia and associate director of the UT Austin COVID-19 Modeling Consortium at the time of the study. “Our risk maps revealed a huge divide between the east side and the west side of Interstate 35. The hardest hit neighborhoods are the ones with the most essential workers, largest household sizes and highest rates of poverty.”
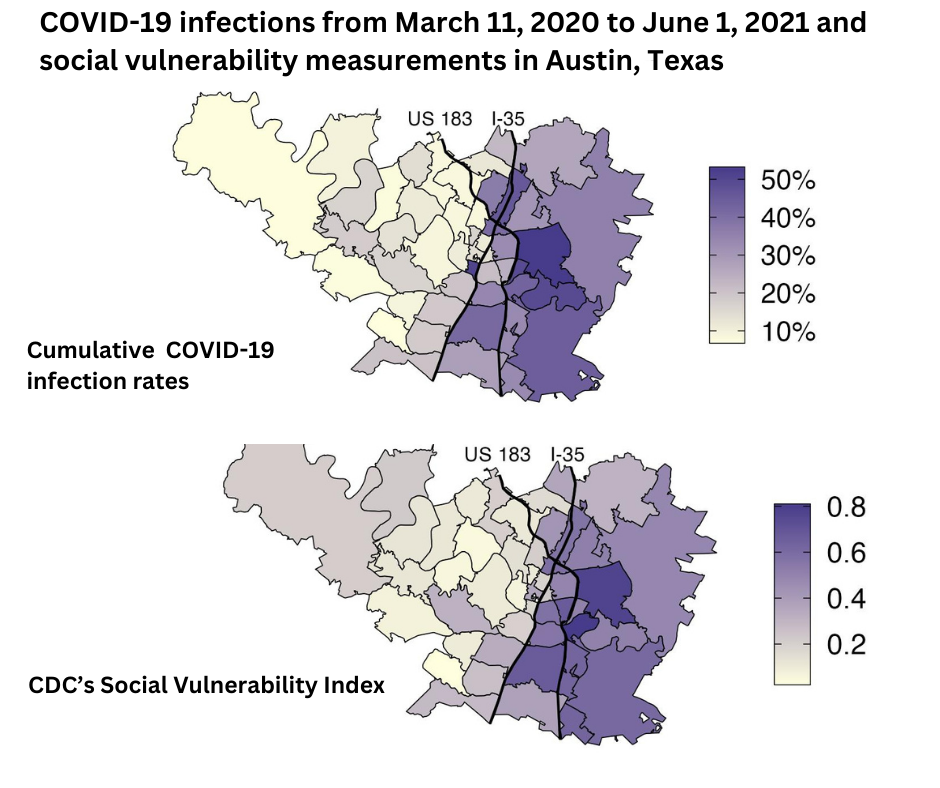
The 78724 ZIP code, which includes the Colony Park and Las Cimas neighborhoods in East Austin, had the highest infection rate in the county at 53.7% during the study period. Meanwhile, the 78732 ZIP code in West Austin, which includes the Steiner Ranch neighborhood, had the lowest rate of infection at 4.8%
While the most socially vulnerable neighborhoods had higher rates of infection, they also had lower rates of reporting, with vulnerable neighborhoods reporting only 1 in 4 infections.
“The communities that suffered the worst in the early months of the pandemic were the least likely to be on the radar of the public health system,” said Meyers.
The study found that disparities in infection rates and hospitalizations were the highest in the first three months of the pandemic. In April 2020, people living in vulnerable ZIP codes were nearly 10 times as likely to be infected as those living in less vulnerable areas. The disparity gap decreased over time, possibly due to public health efforts to mitigate risks and increase access to testing, or because higher initial infection rates increased immunity in vulnerable regions more quickly than in other regions.
“Early measures to protect these vulnerable communities just weren’t enough,” said Fox. “The gap between these regions never closed completely. As we plan for future public health crises, addressing these disparities will require more resources and longer-term interventions to address the many factors that contribute to vulnerability.”
Emily Javan, Rémy Pasco, Briana Betke, José L. Herrera Diestra, Spencer Woody, Kelly Pierce, Maureen Johnson-León and Lauren Ancel Meyers of UT Austin; Graham C. Gibson of Los Alamos National Laboratory; Kaitlyn E. Johnson of the Rockefeller Foundation; and Michael Lachmann of the Santa Fe Institute also contributed to the research. The research was funded by the CDC, the National Institutes of Health and a donation from Tito’s Handmade Vodka.